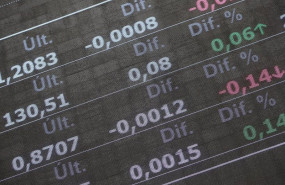
El mercado relativiza la crisis entre Irán e Israel, pero "hay inquietud"

Tubacex lleva cerca de cuatro meses digiriendo las subidas de finales de 2023.
| Nombre | Volumen |
|---|---|
| Iberdrola | 44.708.415 |
| Banco Santander | 35.262.809 |
| Banco Sabadell | 24.108.867 |
| IAG | 16.677.781 |
| BBVA | 15.162.715 |
• Aquí aparecerán sus últimas fichas visitadas •
|
No hay eventos para la fecha/s seleccionada/s
|
| Fecha | Valor | Broker | Recomendación | Objetivo |
|---|---|---|---|---|
| 19 abr | BCO SABADELL | RBC | SOBREPONDERAR | 1,90€ |
| 19 abr | BANKINTER | Barclays | MANTENER | 7,80€ |
| 19 abr | ARCELORMITTAL | Barclays | MANTENER | 26,00€ |
| 18 abr | BANKINTER | Renta 4 | SOBREPONDERAR | 7,90€ |
| 18 abr | GESTAMP AUTOMOCION | JP Morgan | NEUTRAL | 3,20€ |
| Fecha | Valor | Broker | Recomendación | Objetivo |
|---|---|---|---|---|
| 19 abr | ADIDAS NOM. | Deutsche Bank | COMPRAR | 250,00€ |
| 19 abr | RHEINMETALL | Deutsche Bank | MANTENER | 510,00€ |
| 19 abr | L'OREAL | Barclays | SOBREPONDERAR | 480,00€ |
| 18 abr | ADIDAS NOM. | Barclays | SOBREPONDERAR | 213,00€ |
| 18 abr | ASML HOLDING | Berenberg | COMPRAR | 1,10€ |


